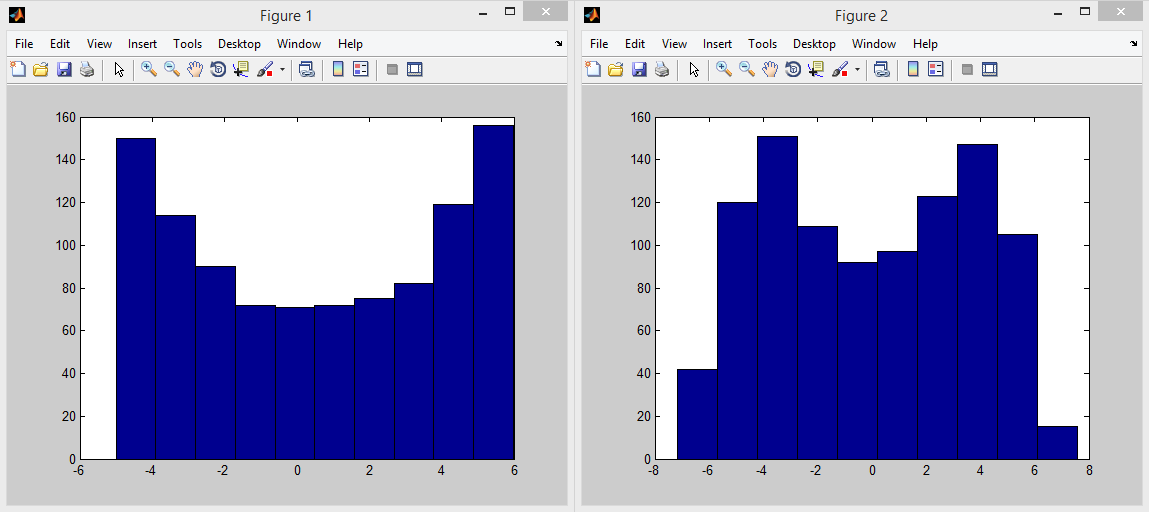
Histogramy 10/02/2024 MATLAB Program: tworzący zwykłą funkcję, która następnie poddawana jest szumowaniu. Zostają porównane histogramy oraz obliczone różne podstawowe działania:wartość maksymalna,wartość minimalna,odchylenie standardowe,średnią.Kompilator: MATLAB Galeria: Program w akcji. Kod programu: close all; clc clear all; a = 5; fx = 10; n = 1000; t = 1:n+1; x = a*sin(2*pi*fx*t); r = rand(1,n+1); % Szum równomierny rg = randn(1,n+1); % Szum gaussowski %plot(t,x); fp = 1000; % Histogram z częstotliwością 1000Hz dt = 1 / fp; u = dt*t; s = a*sin(2*pi*fx*u); z = s + r; zg = s + rg; hist(z); figure(); hist(zg); odchylenie = std(s); srednia = mean(s); max = max(s); min = min(s); Grafika MATLAB Program Programowanie grafiki